Đang tải dữ liệu ...
Trang chủ
Kinh Doanh Hà Nội 1
live:70ecda23a35b5e1e
Kinh Doanh Hà Nội 2
live:70ecda23a35b5e1e
Kinh Doanh HCM 1
live:70ecda23a35b5e1e
Kinh Doanh HCM 2
thu.hien968
Hỗ Trợ Kỹ Thuật 1
vinhbkhutskype
Hỗ Trợ Kỹ Thuật 2
vinhbkhutskype

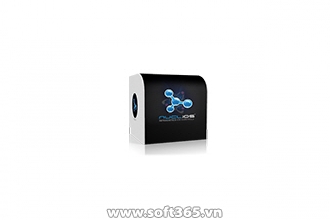
NUCLiOS 2014

Infragistics NucliOS delivers high performance, highly visual, totally native iPad and iPhone controls. Built with performance and style in mind, NucliOS offers an advanced Data Grid and a powerful set of versatile charts perfect for mobile applications in the consumer marketplace or the enterprise.
Giá: Liên hệ
Nhà sản xuất: Infragistics
Kho hàng: Có hàng
Lượt xem: 768
Chia sẻ:
Tính năng
Yêu cầu hệ thống
Download
Sản phẩm liên quan

Features

Capabilities include:

  • Chart category series - from line and bar to spline area and waterfall series, the iOS Data Chart supports all your 'bread & butter' charting needs for every day scenarios.
  • Chart data binding - leverage the Infragistics Data Source Helper to wire-up your charts to various data sources and benefit from simplified data binding.
  • Chart display - customise your charts through several configuration options affecting the axes and legends, including multiple axes, legends/multiple legends, custom axis scale.
  • Chart financial series & indicators - financial charting scenarios offer support for both Candlestick and OHLC bar charts, as well as many built-in financial indicators.
  • Chart markers - choose from 10 different types of markers to easily show your data points on the various chart types, including squares, triangles, circles, hexagons and more.
  • Chart multiple series - the iOS Data Chart control is designed for modularity of chart series. Multiple chart series are supported to create composite charts for better data comparisons on the same surface.
  • Chart navigation - use natural multi-touch gestures for panning & zooming to drill-down to specific data points, or zoom out to see the big picture of your data.
  • Chart scatter series - also known as Scatter Plots or scatter graph, this type of mathematical diagram offers the benefits of Cartesian coordinates to display values for two variable for a set of data.
  • Chart - scientific charts - from wind patterns to performance metrics, Polar and Radial series can expose new insights in many scientific data sets.
  • Chart theming - use Chart Themes to give a Chart a consistent and color coordinated look and feel. Simply set the IGChartView theme property to one of the predefined themes.
  • Chart trend lines - each Chart series offers support for multiple types of trend lines. The trend lines are also compatible with the Motion Framework to provide smooth transitions when the data set changes.
  • Grid data binding & source helper - to get data into the grid, use the integrated helper that will make it easier to bind arrays to the grid.
  • Grid context menu - press and hold on a cell to display a custom context menu.
  • Grid data filtering - enable filtering on any grid column by using the filteringKey property of IGGridViewDataSourceHelper.
  • Grid data layout - the Grid supports flexible layout options to present your data exactly the way you want it.
  • Grid data manipulation - the Grid allows users to interact with its data in various ways.
  • Grid formatting & styling - from photo albums and slideshows to movie collections and sales reports, the NucliOS grid can be styled to look like almost anything.
  • Grid interactions - the Grid is highly interactive and is designed with a touch-first approach.
  • Grid navigation - the Grid supports multiple interactions to navigate through the data.


Chưa có hoặc chưa được cập nhật!
Total load time (116.118.48.94) : 0.07331s